What we cover in this blog
Types of Data Analytics
There are mainly four types of data analysis: diagnostic, descriptive, prescriptive, and predictive analytics. Each statistical analysis system has different objectives and places in the data analysis process, and they are also the primary data scientists’ applications in business.
Analytics in the form of intelligence solutions has been in business for quite some time now, and many organizations are adopting analytics in their daily operations. The numbers have been remarkable, but a new generation of software must enable new and old customers to scale to new pinnacles. It is possible with guidance from data collection and data management service providers.

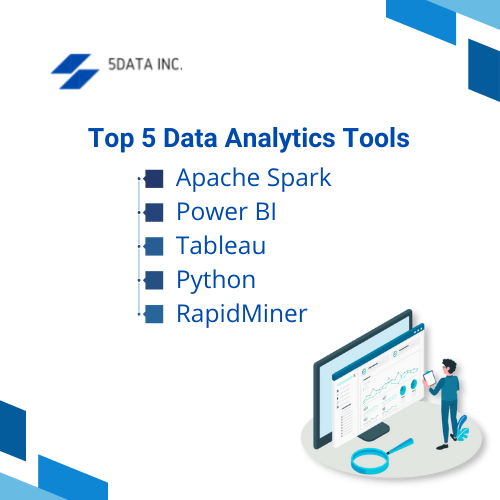
Top 5 Data Analytics Tools
The new trend of integrating all key facets relies on modern data analysis tools, such as the ones defined below.
Apache Spark
The title of our strongest soldier is going to be awarded to Apache Spark. The main aim of Apache Spark, first publicized in 2014, was to designate a new framework for fast iterative processing, just like machine learning and interactive data analytics software, besides retaining the scalability and fault tolerance of Hadoop MapReduce.
Apache Spark is an open-source, multilingual data processing engine that can be utilized to build distributed streams, batch processing operations, and big data analytics for comprehensive data workloads. In short, Apache Spark is a distributed, general-purpose computing engine that can analyze and process large data files from various sources such as S3, Azure, and HDFS.
Combine in-memory cache operations and improve query execution for fast analytical queries on data to any extent. It additionally delivers development APIs for Java, Scala, Python, and R to facilitate code reuse across workloads such as batch processing, real-time analytics, machine learning, interactive query, cloud-based data platform, and graph processing. 5Datainc has harnessed the Apache Spark data analytics tool in its operations to cater to your advanced analytics needs.
Power BI
While many data analysis tools have lost value, Microsoft continues to evolve Power BI to meet changing industry needs. Power BI started as a simple analytics tool with machine learning abilities for sentiment analysis and easy integration with other outlets to streamline analytics workflows. It can easily generate interactive visual reports and dashboards.
Power BI enables organizations to add acuity labels to data, comply with privacy rules, and enhance cross-departmental collaboration. In 2021, the company also revealed a library for integrating Power BI reports with Jupyter notebooks, one of the widespread data science tools.
Similar developments by Power BI have been recognized by Gartner, making it second to Apache Spark in terms of leading in analytics and business intelligence media for 14 successive years. Power BI offers a free version for individual learning, but smaller organizations have Power BI Pro. Larger organizations can also opt for Power BI Premium to access advanced characteristics like data management, capacity, and more.
Tableau
With its establishment in 2003, Tableau Software is a frontiersperson in sustaining online and on-premises workflows. Due to its easy usage and superior user interface, Tableau was a direct contender to Power BI. With its server architecture, Tableau offers better adaptations to different enterprise requirements. But what makes the Tableau software stand out for pupils and other professionals is the ability to share engaging dashboards even with individuals who don’t have Tableau installed.
Tableau Public is a free Tableau software that can be utilized to create visualizations, but you must save the workbooks or sheets to Tableau Server for anyone to view. Premium plans also offer new features for those who wish for additional attributes. Tableau has three models called Creators, Explorers, and Viewers. Tableau Viewer can only interact with dashboards and visualizations. By difference, Tableau Explorer and Tableau Creator let you organize and manage your data.
Python
Python was launched as an object-oriented programming language for software and web app development but was later extended to satisfy data research needs. Python is the current most popular programming language.
It is a refined data analysis tool with a large assemblage of user-friendly libraries for all aspects of scientific computing. Python is also a free, open-source programming language that is uncomplicated to learn.
Other libraries, just as Scipy, Scikit-learn as well as StatsModels, are used for statistical modeling, mathematical techniques, machine learning, and data mining. Data visualization and graphical analysis packages include Seaborn, Matplotlib, and Vispy. Python is the most widely used programming language and has a large developer community.
RapidMiner
RapidMiner is an enterprise data analysis platform that analyzes the impact across your association’s people, understanding, and data. RapidMiner is based on a client-server architecture, and servers are available locally and in general and private cloud infrastructures.
RapidMiner’s data analysis platform suits various analytics users across the AI lifecycle. According to RapidMiner, their platform is used by over 1 million people. RapidMiner offers 99% of cutting-edge analytics solutions through a template-based framework. This framework diminishes errors and speeds up deployment by making code less lengthy.
Data visualizations and transformation, data preparation plus visualization, predictive analysis, statistical modeling, evaluation, and dispersal are all part of RapidMiner’s data machine learning operations. RapidMiner has a (GUI) graphical user interface for concocting and running analysis workflows.
Conclusion
A data analyst, with the help of data science platforms, can reduce the time and effort to make exploratory data analysis. The statistics analytics enterprise has greatly affected companies, particularly in their everyday operations, and data analytics has enabled the enterprise to automate several factors.
To utilize the benefits of data analytics to its complete capability, one has to hold close desirable possibilities like those provided by 5DataInc. We are a data integration platform that manages business operations like no other and makes you a professional in key technology associated with data analytics.

Annanya Adyasha
Author
